Empirica Signal: Market Health, 18 Oct 2026
This week's reading: selling eases, but no reversal yet
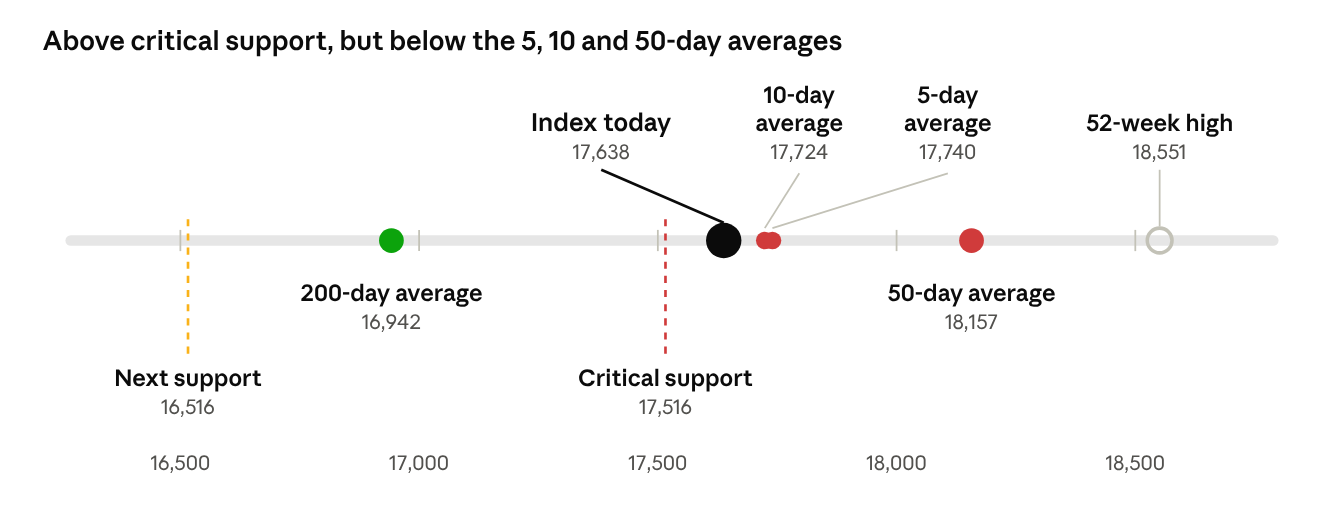
The Nifty Smallcap 250 ended a 5-week losing streak, closing up 0.36% at 17,638 on Friday. This is not a trend reversal. It shows a little strength and less selling pressure. The index is still below its 50-day average, so the medium-term trend remains weak.
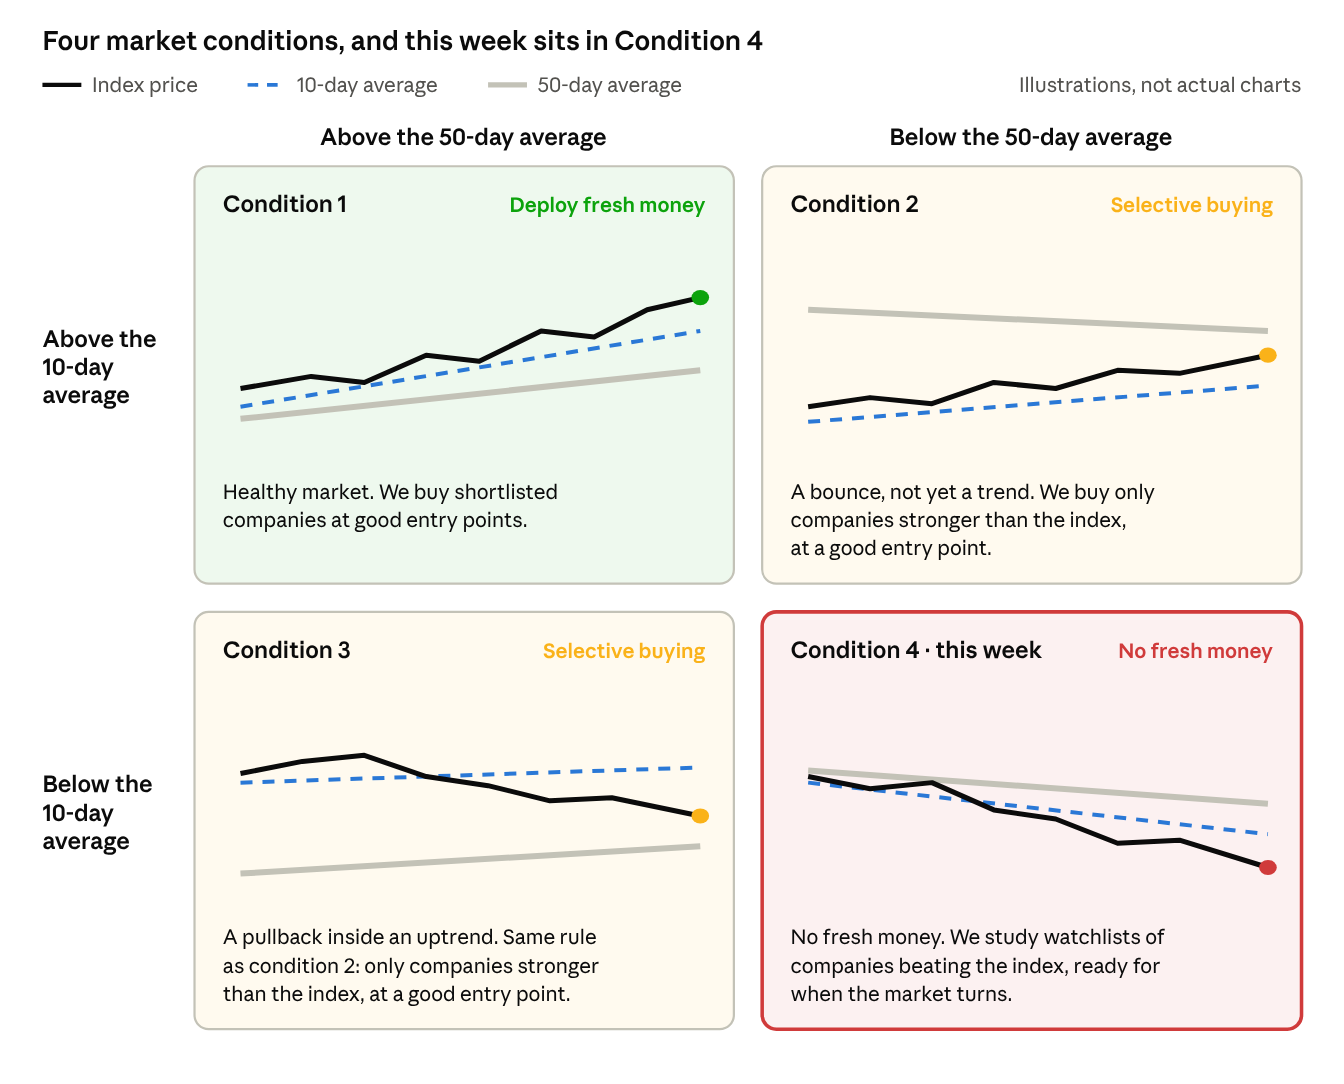
Market condition this week: Condition 4, no fresh money. We remain very selective with fresh money.
|
Level we track |
Value (16 Oct 2026 close) |
Index vs this level |
What it tells us |
|---|---|---|---|
|
Index close |
17,638 |
— |
Up 0.36% this week; 4.9% below its 52-week high of 18,551 |
|
5-day average |
17,740 |
0.6% below |
Very short term |
|
10-day average |
17,724 |
0.5% below |
Short term: index below it, so condition 4 |
|
50-day average |
18,157 |
2.9% below |
Medium-term trend still under pressure |
|
200-day average |
16,942 |
4.1% above |
Long-term trend intact |
|
Critical support |
17,516 |
0.7% above |
Held this week |
|
Next support |
16,516 |
6.8% above |
Where a fresh sell-off could take the index |
Nifty 50 shows real strength: up 2.78%
The Nifty 50, India's index of the 50 largest companies, rose 2.78% this week on the weekly price chart and closed at 23,146 on Friday. Last week it broke an 8-week losing streak; this week it built on that.
|
What happened |
Why it matters to us |
|---|---|
|
Large companies rose for a second straight week |
A reversal in the Nifty 50 may be starting |
|
The rally was led by large information technology companies |
Small companies took part far less |
|
Selling pressure in large companies eased further |
Money tends to flow down to smaller companies once large ones stabilise |
Further support from the Nifty 50 can limit the selling in the Nifty Smallcap 250 as liquidity improves. Liquidity here means how much money is moving into shares. The small-company index still has to show this on its own chart before we change our stance.
Last week's take, and what changed
Last week (10 October) we said: the index was in a heavy selling zone, only 0.3% above its critical support of 17,516. A break below could take it to 16,516. We advised against fresh money and stayed very selective. The Nifty 50 had just broken its 8-week losing streak with a 0.44% gain, an early positive sign.
This week: the support held. Selling eased, the small-company index posted its first weekly gain in five weeks, and the Nifty 50 followed through with a much stronger week.
|
What we track |
Last week (9 Oct close) |
This week (16 Oct close) |
Direction |
|---|---|---|---|
|
Nifty Smallcap 250 |
17,575 |
17,638 |
Up 0.36%, 5-week losing streak ended |
|
Index vs critical support (17,516) |
0.3% above |
0.7% above |
Support held |
|
Index vs 50-day average |
3.4% below |
2.9% below |
Gap narrowing |
|
Index vs 200-day average |
3.9% above |
4.1% above |
Steady |
|
Nifty 50 weekly return |
+0.44% |
+2.78% |
Stronger |
|
Fresh money |
Not recommended |
Cautiously Positive |
Slight Positive (still holidng cash) |
Companies showing relative strength
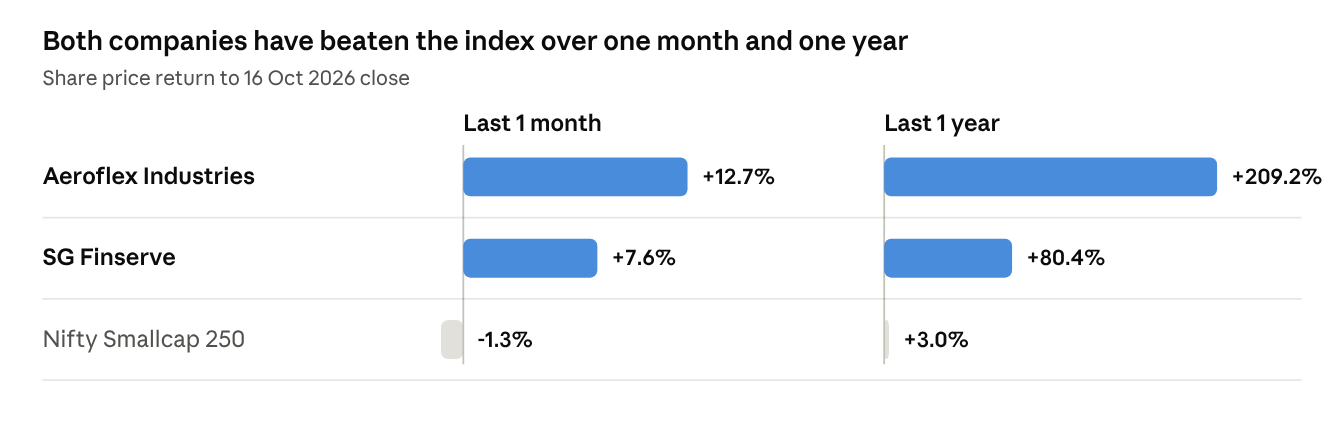
Two companies on our watchlist and in our portfolio are holding up far better than the index. When the market turns, companies like these are where fresh money is most likely to go first.
|
Company |
What it does |
Market value |
Price (16 Oct) |
|---|---|---|---|
|
Makes stainless-steel flexible hoses and flow products for aerospace, semiconductor and petrochemical industries |
₹6,958 crore |
₹525.80 |
|
|
A non-banking finance company lending to dealers, retailers, vendors and logistics firms in supply chains |
₹4,373 crore |
₹676.70 |
Both sit inside our ₹2,000 to ₹30,000 crore range. A strong relative strength line is the first filter, not the decision: each company still goes through our full business review before any fresh money goes in.
These are not recommendations to buy or sell. Empirica India may hold positions in these companies.
Why we watch the Nifty Smallcap 250
We invest mostly in companies with a market value between ₹2,000 crore and ₹30,000 crore. The Nifty Smallcap 250 index is made of exactly this kind of company. When it is healthy, the tide lifts our boats. When it is weak, even good companies find it hard to rise.
We read the index against four moving averages. A moving average is simply the average closing price over the last few days: the 10-day average is the average of the last 10 closes. It smooths out daily noise and shows the direction of travel. We check each one on the daily chart and on the weekly chart.
|
Average |
Time it covers |
The question it answers |
|---|---|---|
|
5-day |
About one trading week |
Is the mood improving or worsening right now? |
|
10-day |
About two trading weeks |
Do buyers have short-term control? |
|
50-day |
About two and a half months |
Is the medium-term trend up? |
|
200-day |
About ten months |
Is the long-term trend up? |
Track the index yourself: Nifty Smallcap 250 chart on TradingView.
Our rulebook: four market conditions
Where the index closes against its 10-day and 50-day averages puts the market in one of four conditions. Each one tells us how we treat fresh money.
|
Condition |
Index vs 10-day |
Index vs 50-day |
What we do with fresh money |
|---|---|---|---|
|
1 |
Above |
Above |
Buy our shortlisted companies once we find a good entry point. A healthy market. |
|
2 |
Above |
Below |
Buy only companies whose price is stronger than the index, at a good entry point. |
|
3 |
Below |
Above |
Same as condition 2. |
|
4 |
Below |
Below |
No fresh money. Build and study watchlists of companies showing strength against the index. |
Conditions 2 and 3 are not normal buying markets. The direction is unclear, so each company has to earn its place by beating the index first.
Relative strength: is the company beating the market?
Relative strength compares a company's share price with the index, every day. We divide the stock price by the index price and plot the result as a line. Only the direction of that line matters, not its value.
If the line rises, the stock is doing better than the market. If it falls, the stock is doing worse, even when its own price is going up.
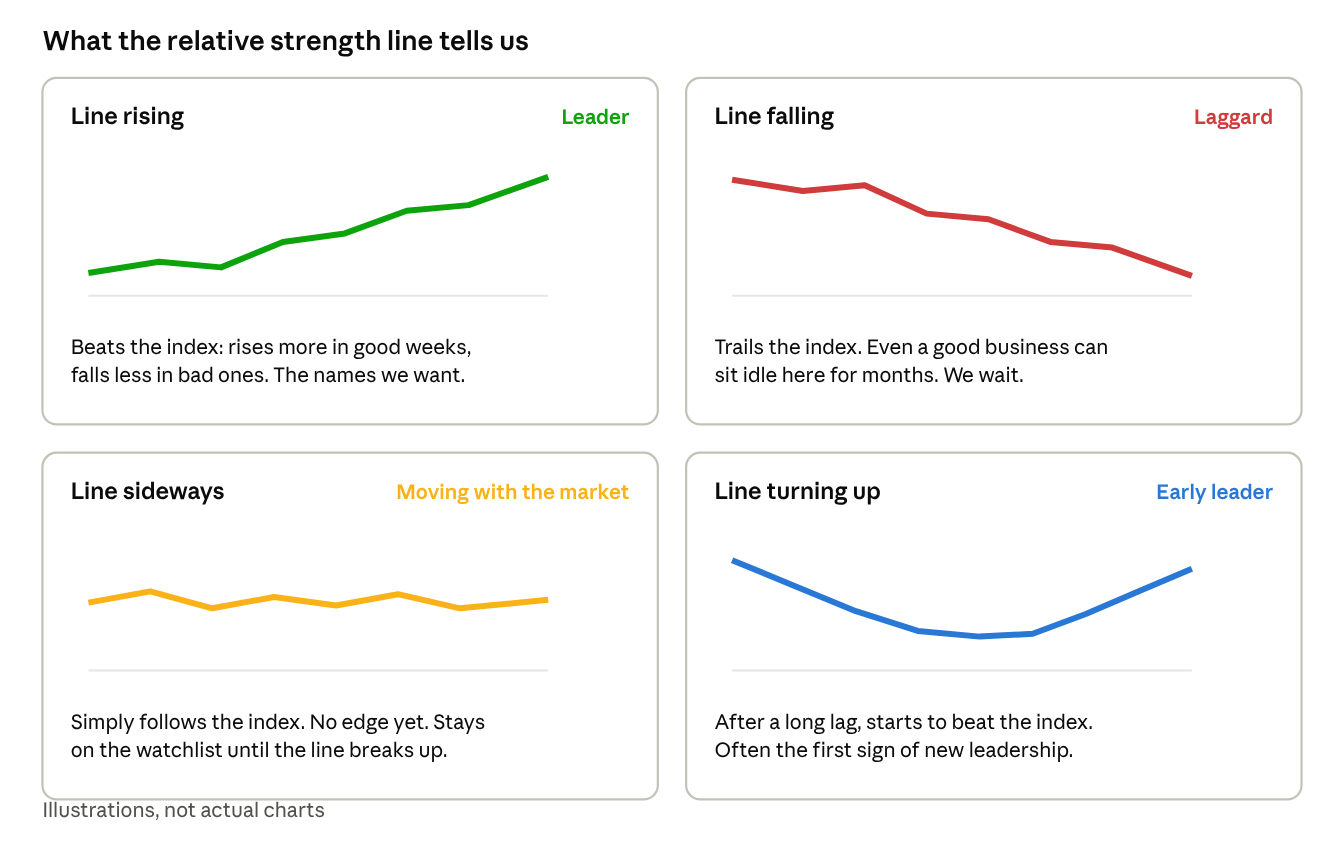
We track this line on three charts:
|
Chart |
What it shows |
How we use it |
|---|---|---|
|
Daily |
The last few weeks |
Timing a good entry point |
|
Weekly |
The last several months |
Confirming the trend is real |
|
Monthly |
The last few years |
Checking the long-term leadership story |
The strongest case is a line rising on all three charts. Aeroflex Industries and SG Finserve, above, are this week's examples of companies whose line has been rising while the index fell.
What we are doing this week
Selling has eased, but one positive week is not a new trend. Fresh money still waits, and we use this time to sharpen the buy list.
- Stay very selective. No new money into equities until the index closes back above its 10-day and 50-day averages, or a company clears the relative strength test on its own.
- Follow the Nifty 50. If large companies keep rising, liquidity should improve and the selling in small companies should keep easing.
- Track the leaders. We follow companies like Aeroflex Industries and SG Finserve on daily, weekly and monthly relative strength charts.
- Check the business. Every company that shows strength goes through our review of earnings, balance sheet, management and valuation.
- Mark the entry points. For each company that passes, we note the price levels where we would act once the market turns healthy again.
|
What would change our view |
Signal |
|---|---|
|
Index closes back above its 10-day and 50-day averages and holds there |
Condition 1: time to deploy fresh money |
|
Index closes above only one of the two averages |
Condition 2 or 3: selective buying only |
|
Index closes below 17,516 |
Selling resumes; next support at 16,516 |
Sources
- Nifty Smallcap 250 close of 17,638 and 50-day and 200-day averages, 16 October 2026: Dhan
- Index returns over 1 week, 1 month and 1 year, and 52-week high: Sharpely
- Nifty 50 weekly gain and Friday close: Kotak Neo weekly wrap
- Company prices, market values and returns: Tickertape: Aeroflex Industries, Tickertape: SG Finserve
- Support levels of 17,516 and 16,516: Empirica India analysis
Uddeshya Goel, CFA. This post is for education and explains the framework Empirica India uses internally. It is not a recommendation to buy or sell any security. Empirica India may hold positions in the companies named. Market levels are as of the close on 16 October 2026 and will change. Past patterns do not guarantee future results. Please consult your own adviser before investing.