Empirica Signal: Market Health | Sep 28, 2026 ·
This week's reading: hold fresh money, build the watchlist
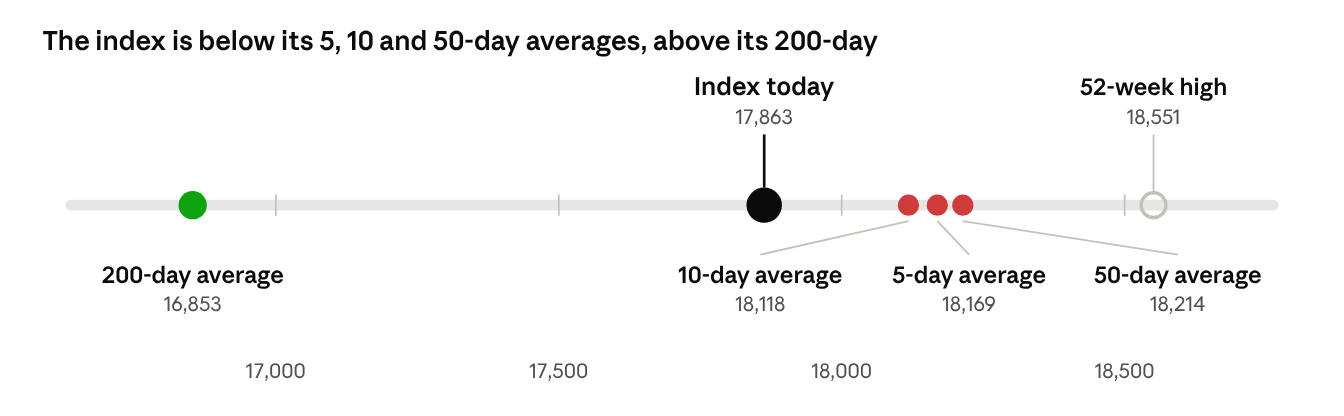
The Nifty Smallcap 250 index has fallen below both its 10-day and 50-day average price, and it has crossed these two lines twice in the last 13 trading days. When the market keeps slipping back and forth across its own averages, it is running out of energy. Buyers are not strong enough to hold prices up.
Market condition this week: Condition 4, no fresh money deployment, and stay put.
|
Average price we track |
Level (28 Sep 2026 close) |
Index vs average |
What it tells us |
|---|---|---|---|
|
Index close |
17,863 |
— |
3.7% below its 52-week high of 18,551 |
|
5-day average |
18,169 |
Below |
Very short term: weak this week |
|
10-day average |
18,118 |
Below |
Short-term push has faded |
|
50-day average |
18,214 |
1.9% below |
Medium-term trend is under pressure |
|
200-day average |
16,853 |
6.0% above |
Long-term trend is still intact |
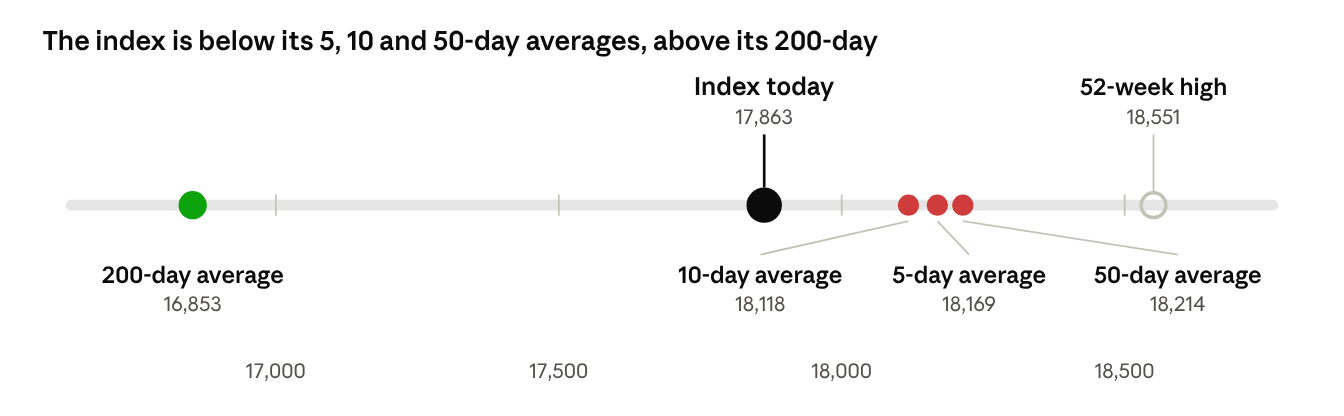
Nifty Smallcap 250 vs its averages · 28 Sep 2026 close, drawn to scale
Our rule reads the 10-day and 50-day averages. The 5-day average gives early warning, and the 200-day average tells us whether the long-term uptrend is still in place. It is, so this is a pause to be careful in, not a reason to panic.
Why we watch the Nifty Smallcap 250
We invest mostly in companies with a market value between ₹2,000 crore and ₹30,000 crore. The Nifty Smallcap 250 index is made of exactly this kind of company. When it is healthy, the tide lifts our boats. When it is weak, even good companies find it hard to rise.
We read the index against four moving averages. A moving average is simply the average closing price over the last few days: the 10-day average is the average of the last 10 closes. It smooths out daily noise and shows the direction of travel. We check each one on the daily chart and on the weekly chart.
|
Average |
Time it covers |
The question it answers |
|---|---|---|
|
5-day |
About one trading week |
Is the mood improving or worsening right now? |
|
10-day |
About two trading weeks |
Do buyers have short-term control? |
|
50-day |
About two and a half months |
Is the medium-term trend up? |
|
200-day |
About ten months |
Is the long-term trend up? |
Track the index yourself: Nifty Smallcap 250 chart on TradingView.
Our rulebook: four market conditions
Where the index closes against its 10-day and 50-day averages puts the market in one of four conditions. Each one tells us how we treat fresh money.
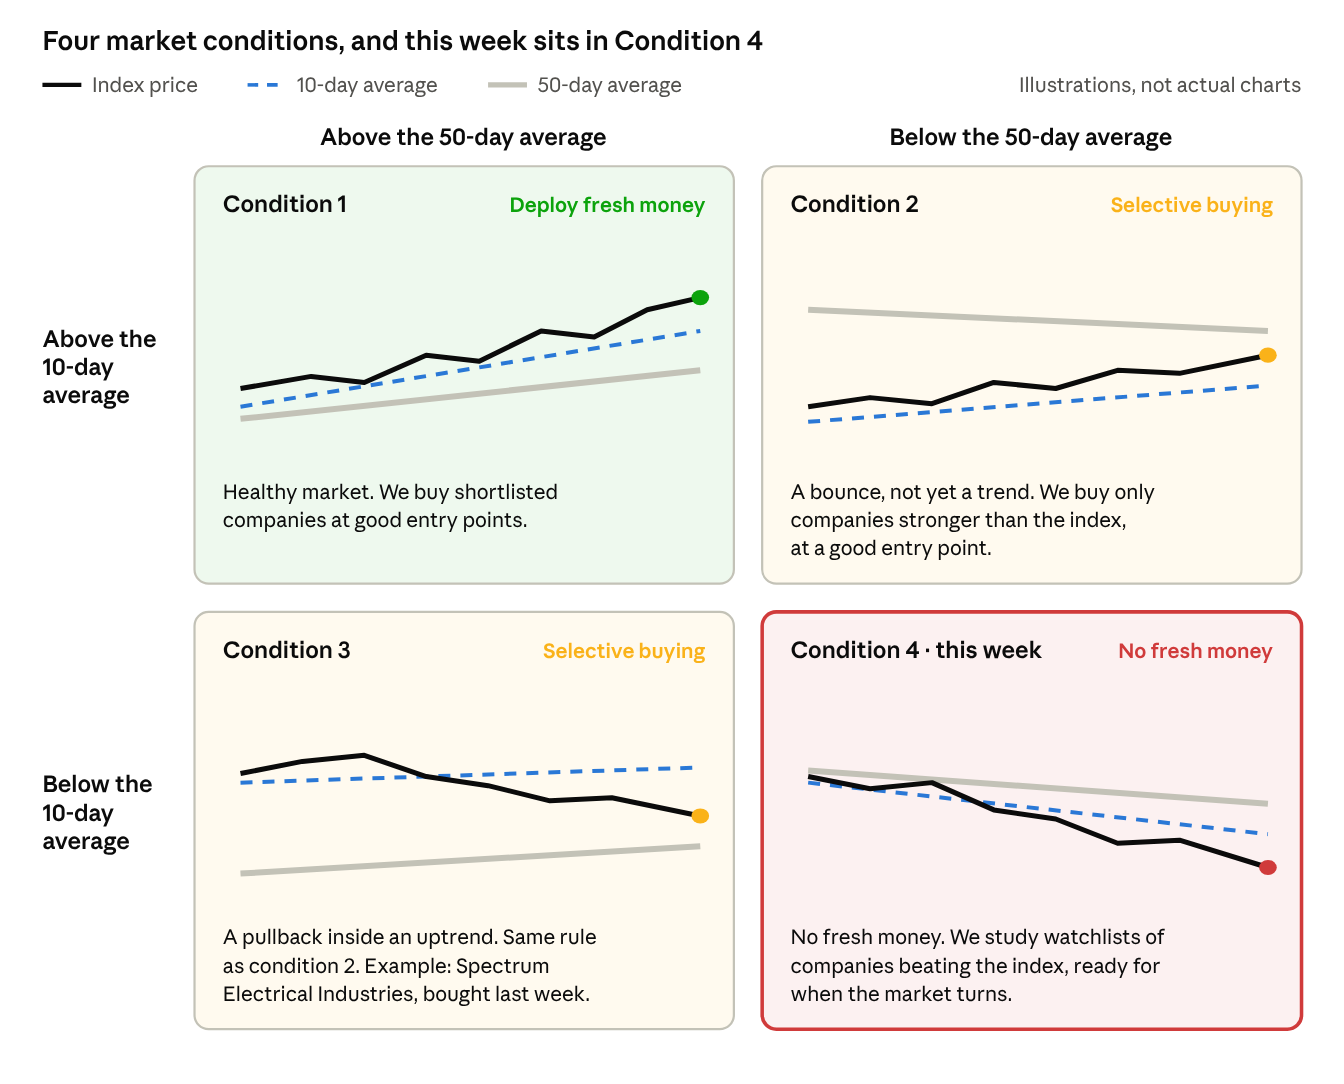
Where the index closes vs its 10-day and 50-day averages · four conditions
|
Condition |
Index vs 10-day |
Index vs 50-day |
What we do with fresh money |
|---|---|---|---|
|
1 |
Above |
Above |
Buy our shortlisted companies once we find a good entry point. A healthy market. |
|
2 |
Above |
Below |
Buy only companies whose price is stronger than the index, at a good entry point. |
|
3 |
Below |
Above |
Same as condition 2. Last week we bought Spectrum Electrical Industries under this rule; the full report comes out this Sunday. |
|
4 |
Below |
Below |
No fresh money. Build and study watchlists of companies showing strength against the index. |
Conditions 2 and 3 are not normal buying markets. The direction is unclear, so each company has to earn its place by beating the index first.
Relative strength: is the company beating the market?
Relative strength compares a company's share price with the index, every day. We divide the stock price by the index price and plot the result as a line. Only the direction of that line matters, not its value.
{Relative strength} = {Stock price}/{Index price}
If the line rises, the stock is doing better than the market. If it falls, the stock is doing worse, even when its own price is going up.
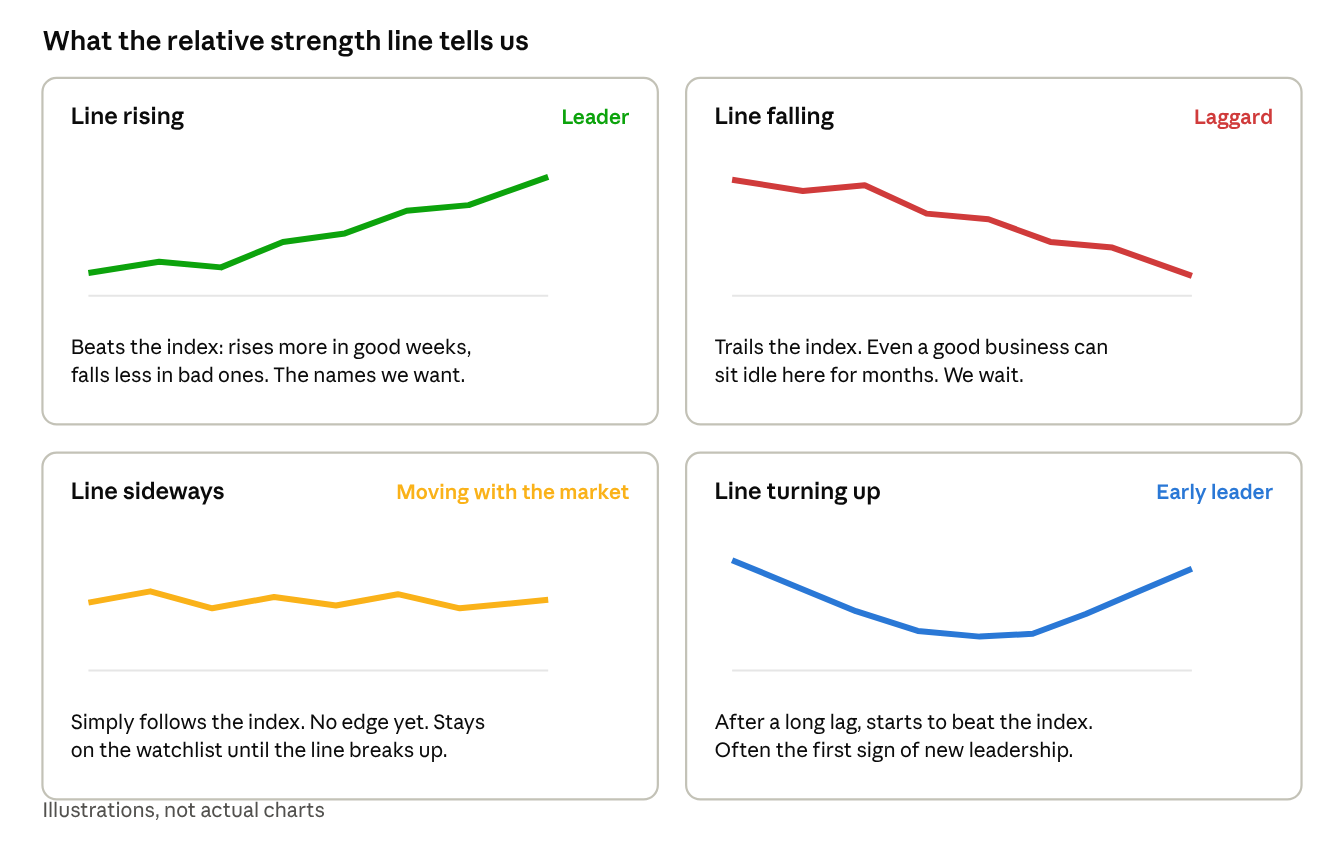
Four shapes of the relative strength line
We track this line on three charts:
|
Chart |
What it shows |
How we use it |
|---|---|---|
|
Daily |
The last few weeks |
Timing a good entry point |
|
Weekly |
The last several months |
Confirming the trend is real |
|
Monthly |
The last few years |
Checking the long-term leadership story |
The strongest case is a line rising on all three charts. A stock that holds up while the index falls, as it is doing now, is showing its hand early.
What we are doing this week
With the index in condition 4, fresh money waits. We keep working: this is when the buy list for the next upturn gets built.
-
Pause fresh buying. No new money into equities until the index closes back above its 10-day and 50-day averages, or a company clears the relative strength test on its own.
-
Scan for relative strength. We go through our older watchlists and flag companies whose relative strength line is rising while the index falls.
-
Check the business. Every flagged company goes through our usual review of earnings, balance sheet, management and valuation. Price strength without a real business behind it does not make the list.
-
Mark the entry points. For each company that passes, we note the price levels where we would act once the market turns healthy again.
What would change our view: the index closing back above both its 10-day and 50-day averages, and holding there instead of slipping back as it did twice this month. We will report it here the week it happens.
Written by Uddeshya Goel, CFA. This post is for education and explains the framework Empirica India uses internally. It is not a recommendation to buy or sell any security. Market levels are as of the close on 28 September 2026 and will change. Past patterns do not guarantee future results. Please consult your own adviser before investing.