How We Select Small and Mid-Cap Stocks: The Recognition Gap | Empirica India
The hardest problem in Indian small-cap investing is not finding a good business. It is finding one at the moment the market starts agreeing with you. We screen price action first and fundamentals second and we give up the first 30-40% of the move on purpose.
Why this, and why now
There are roughly 2,000 listed Indian companies in the ₹2,000–30,000 crore market capitalisation band. Somewhere inside it sit the businesses that will compound five-fold over the next decade. Everyone knows this. It is why the small-cap category attracts the flows it does.
What gets discussed far less is the cost of being early. Not wrong but early. Owning the correct company three years before the market cares about it is one of the most expensive experiences available to a public-market investor, and almost nobody models it before they enter.
This post explains how we approach that problem at Empirica India. It is the foundational piece for everything else we publish from here on, and the later Signal issues on stage analysis, moat assessment, and cash flow forensics all build on the structure laid out here.
The problem: zero-price-action risk
Standard small-cap risk gets described as volatility. That is the wrong risk to worry about first.
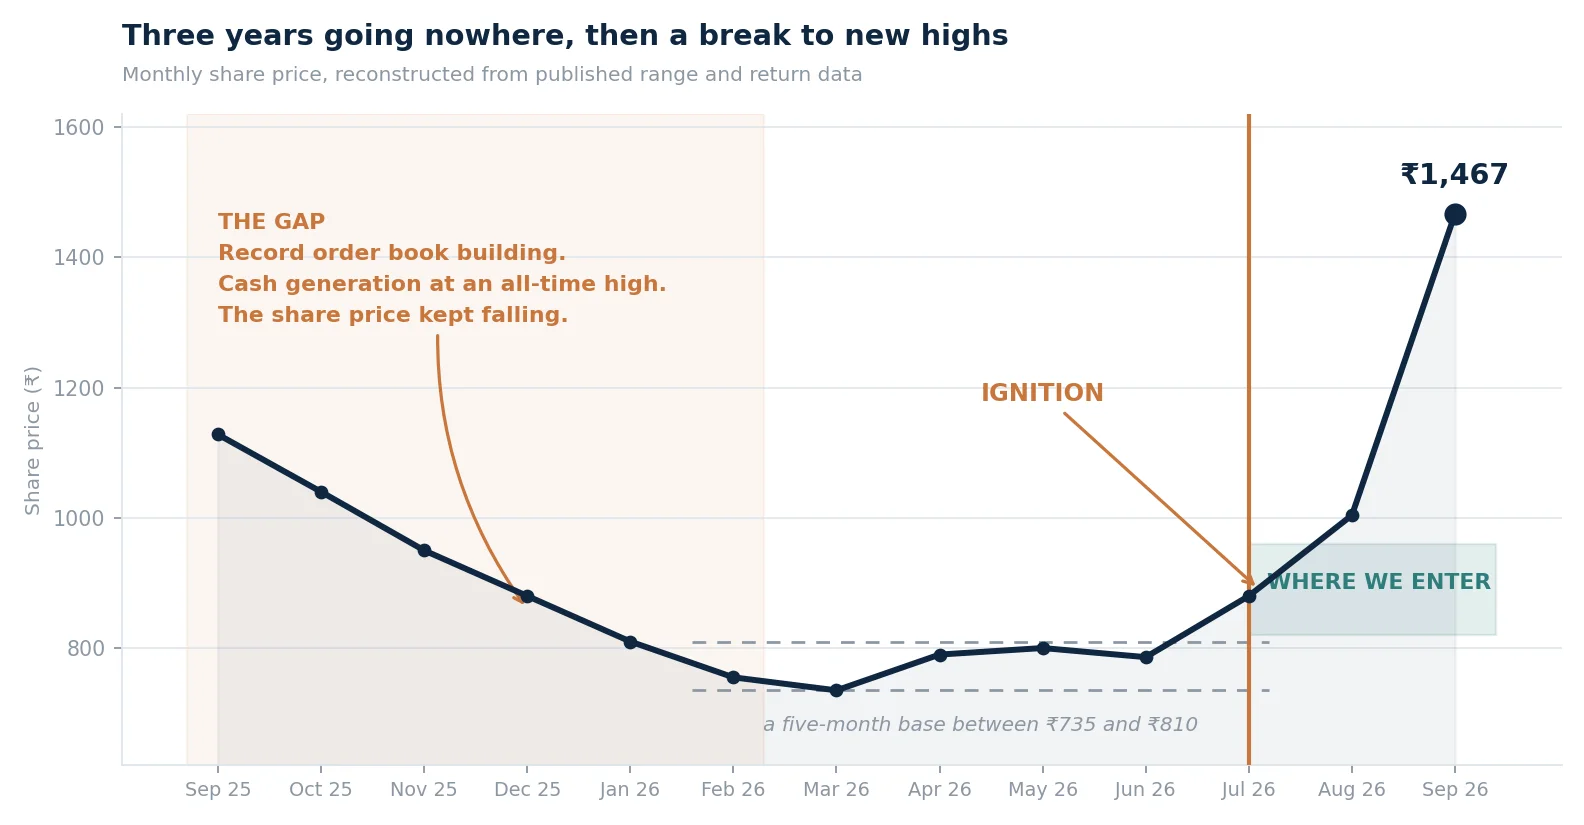
The more corrosive risk in this segment is the opposite of volatility. It is a stock that does nothing at all. A company can deliver four consecutive quarters of 30% revenue growth with expanding margins, and the price can sit exactly where it started: because the float is thin, no institution can build a position without moving the tape, no analyst covers it, and the marginal buyer simply does not exist yet.
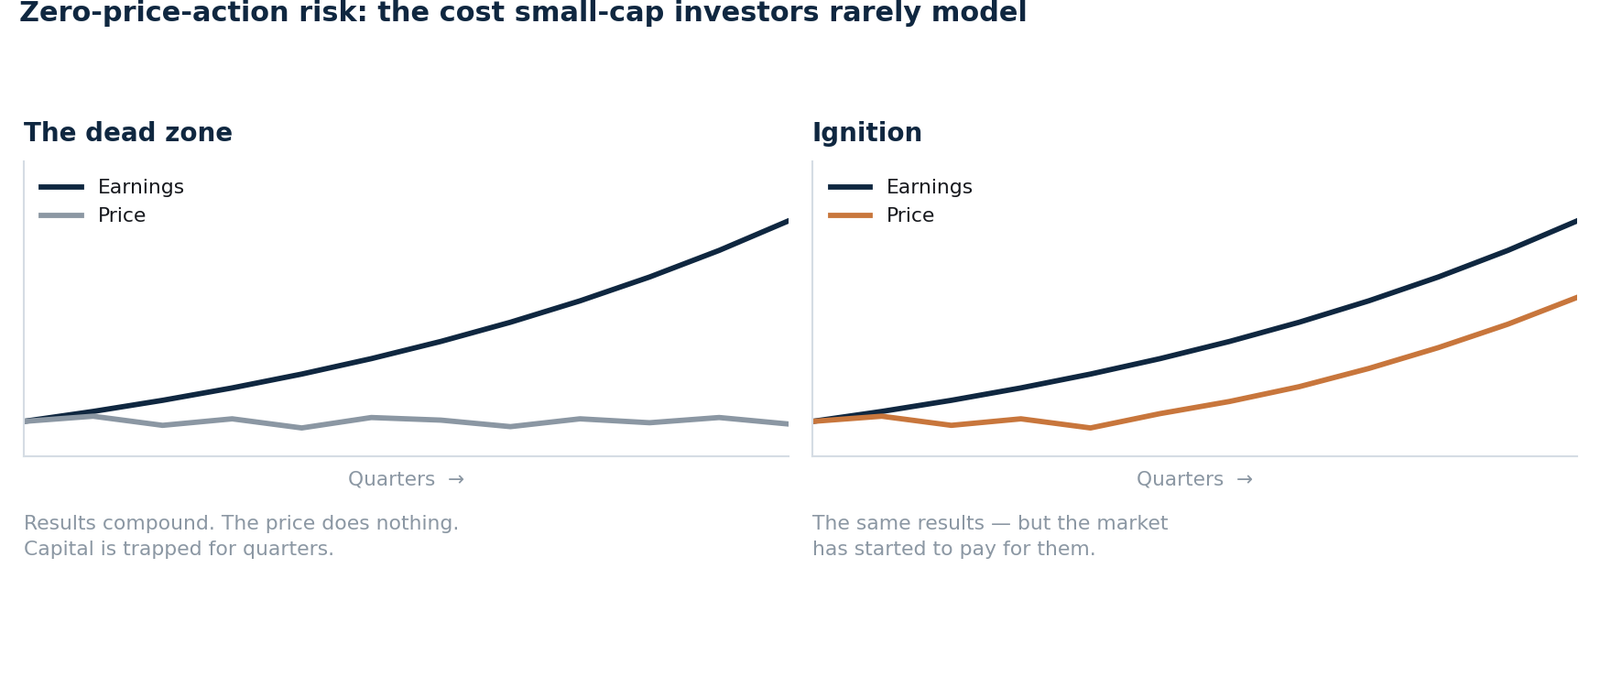
The dead zone versus ignition
We call this zero-price-action risk, and it has three costs that compound against each other.
The opportunity cost is real and compounding. Capital locked in a name that does not move for eight quarters is capital not compounding elsewhere. At a 15% opportunity rate, two dead years costs roughly a third of the capital in real terms before the thesis has even been tested.
The exit is not there when you need it. Thin liquidity is symmetric. The same thin float that prevents the price from rising also prevents you from leaving when the thesis breaks. Position sizing that looked reasonable at entry becomes a value trap on exit. 5 consecutive days of lower circuit can wipe your principal capital by 10-40%, and you won’t be able to sell even a paisa!
Conviction decays. This is the cost nobody writes about. Holding a non-moving position through eight flat quarters while the index compounds is psychologically expensive, and most investors capitulate at precisely the wrong moment, often within a few months of the move they waited three years for. The framework has to account for how humans actually behave, not how they should.
Reading this on a forward? Get the next one directly. Empirica Signal is our free letter. One framework per issue, worked through end-to-end: stage analysis, relative strength, cash flow forensics, moat assessment. No pitch, no picks, no paywall. → Subscribe Free
The Recognition Gap
A good business creates value continuously. The market recognises that value discontinuously.
The distance between those two lines is what we call the Recognition Gap. In a well-covered large cap the gap is narrower and closes almost daily, twenty analysts and a deep institutional bid see to that. In an under-covered smallcap it can stay wide for years, and then close violently over one or two quarters as the market re-rates the entire history at once.
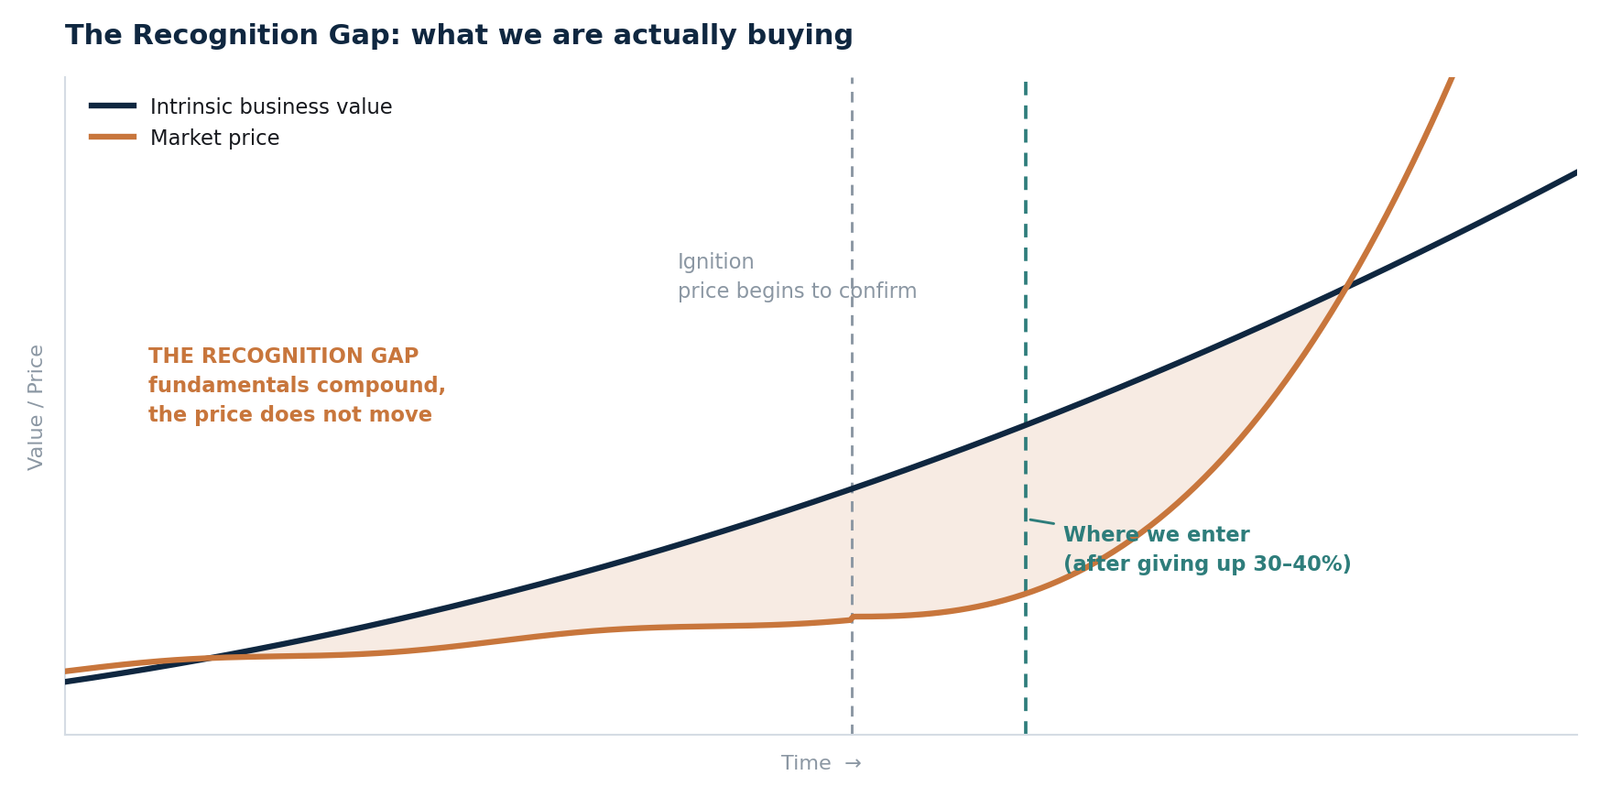
The Recognition Gap
Most small-cap strategies try to buy at the left edge of that gap — as early as possible, as cheap as possible, maximising theoretical upside.
We do not. We wait for the price to begin confirming what the fundamentals already show, and we enter after ignition rather than before it.
That is a deliberate trade. We are willing to give up 30–40% from the base to have the market confirm our thesis before we commit capital. In exchange we get three things that early entry cannot offer: a shorter and more predictable holding period, liquidity that has already begun to improve, and, most importantly, external evidence that we are not the only person who can see it.
The 30–40% we forgo is the price that we at Empirica India pay for that evidence. We think it is cheap.
Why did we invert the process
Conventional stock picking runs fundamentals first: screen for quality and value, build a thesis, then look at the chart to time an entry. Price action is the last step, and often an afterthought.
We run it backwards. Price action is the first filter, (Liquidity is the King!) and fundamentals are the gate that follows.
This inversion is unconventional and it is the part of our process that draws the most disagreement, so it is worth defending precisely. Three reasons:
Price action is the only unfalsifiable evidence that someone else is buying. Every other input, the annual report, the concall, the industry data, tells you what the business is doing. Only the tape tells you whether capital has begun to act on it. In a segment defined by the absence of a marginal buyer, evidence that a marginal buyer has arrived is the single most valuable piece of information available.
It solves the sequencing problem, not the selection problem. We are not claiming that price action identifies good businesses. It does not. It identifies timing, which of the many good businesses is being noticed right now. The fundamental work still decides what we keep. Price action only decides what we look at.
It makes the research economics work. A two-person research desk cannot run institutional-depth fundamental work on 2,000 companies. It can run that work on the thirty that price action has flagged. Inverting the funnel is what makes deep work possible at all.
The obvious objection is that this is just momentum investing with extra steps. It is not, and the difference is the second filter. Momentum alone buys the move regardless of what is underneath it, which is how you end up owning a story stock with no durable business at the top of a cycle. The framework only works because both conditions must hold.
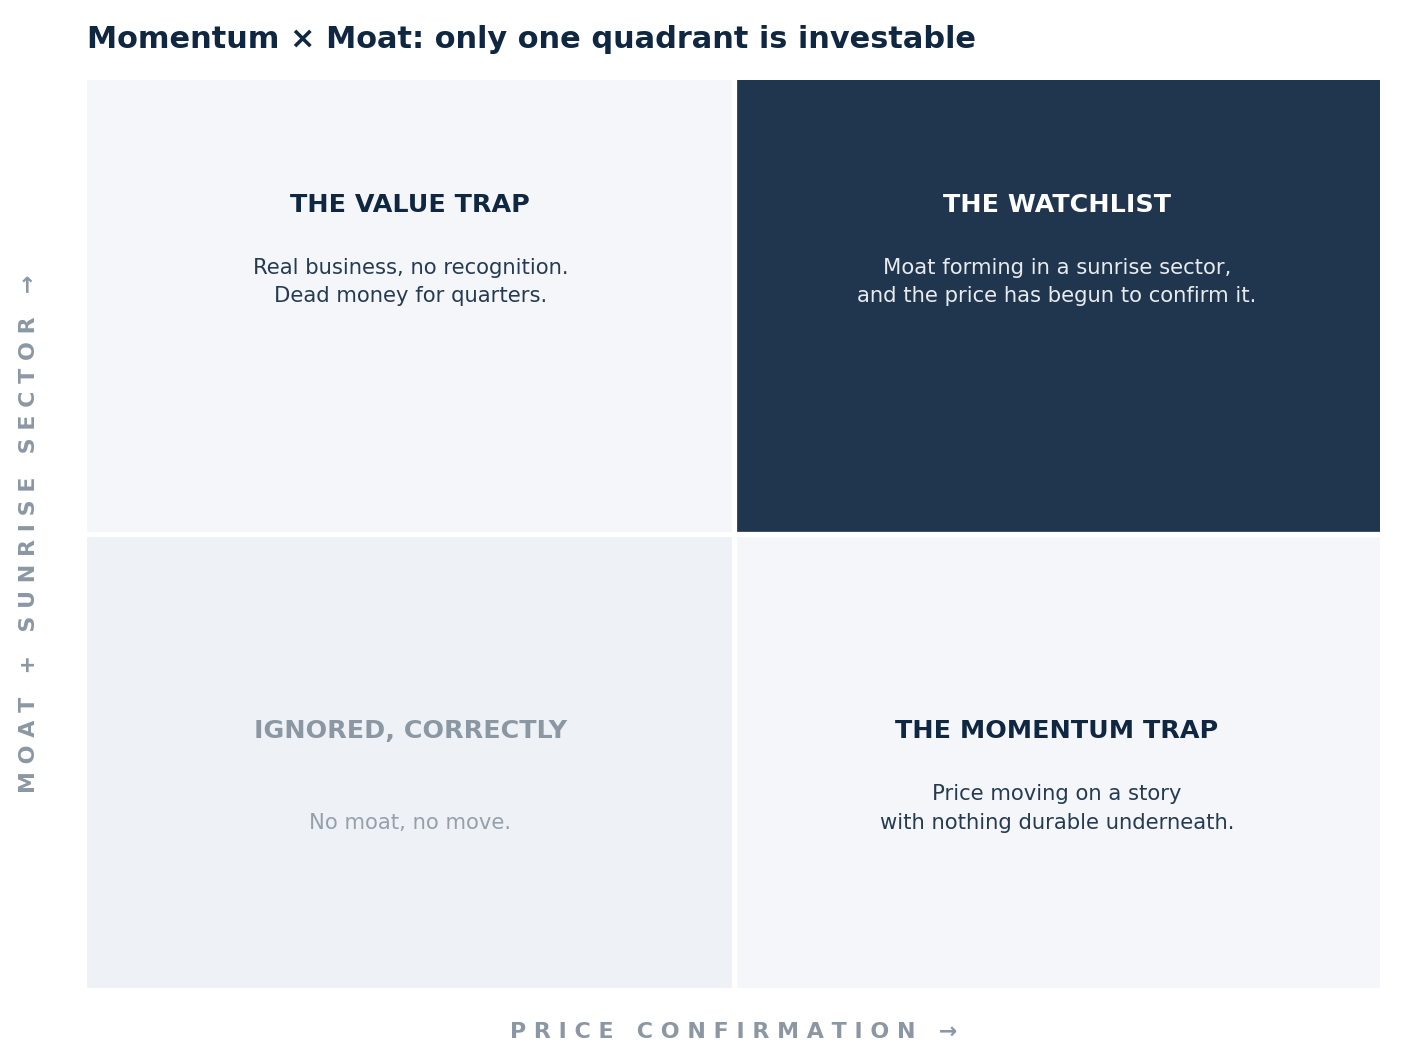
Momentum and moat quadrant
Why the band is ₹2,000–30,000 crore
The market cap band is not arbitrary and it is not a preference. It is a structural constraint with a floor and a ceiling, each set for a different reason.
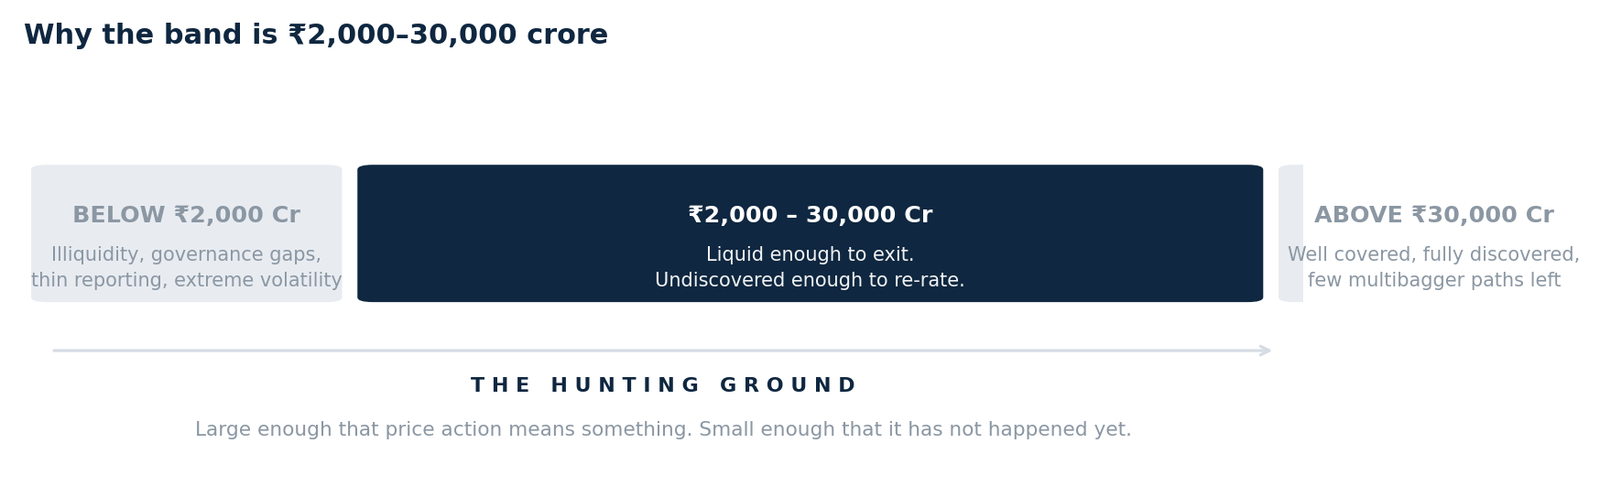
The market cap band
Below ₹2,000 crore, the problems compound multifold. Illiquidity, governance gaps, thin and inconsistent reporting, and extreme volatility do not add up in that segment, they multiply. A governance problem in an illiquid stock is not two problems, it is one unexitable problem. The quality of disclosure also falls off sharply: concalls become irregular or non-existent, segment reporting thins out, and the raw material for genuine fundamental work simply is not there. We are not claiming nothing works below ₹2,000 crore. We are saying the work required to underwrite it safely is disproportionate to the capital that can be deployed into it.
Above ₹30,000 crore, the gap has already closed. This is a well-covered world. Multiple brokerages publish on every name, institutional ownership is established, and price discovery is efficient enough that the Recognition Gap we are trying to capture rarely exists at meaningful width. There are excellent businesses above ₹30,000 crore. There are very few undiscovered ones.
The band between the two is where the arithmetic works: large enough that price action carries information and an exit exists, small enough that the recognition has not yet happened.
The Ignition Framework
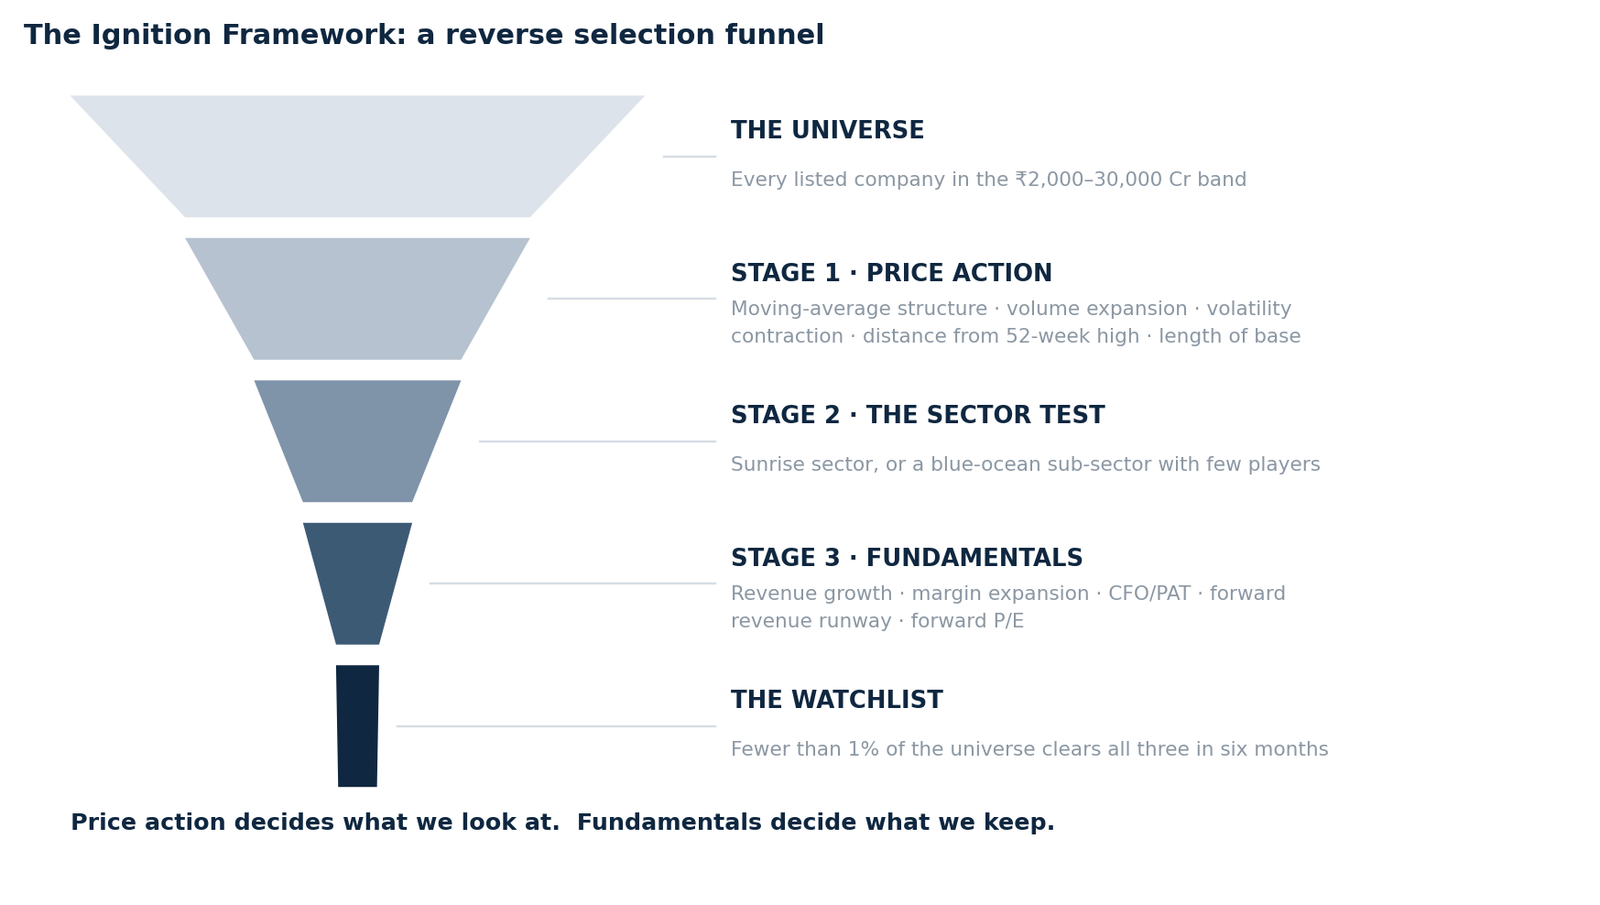
Three sequential filters. A company must clear all three.
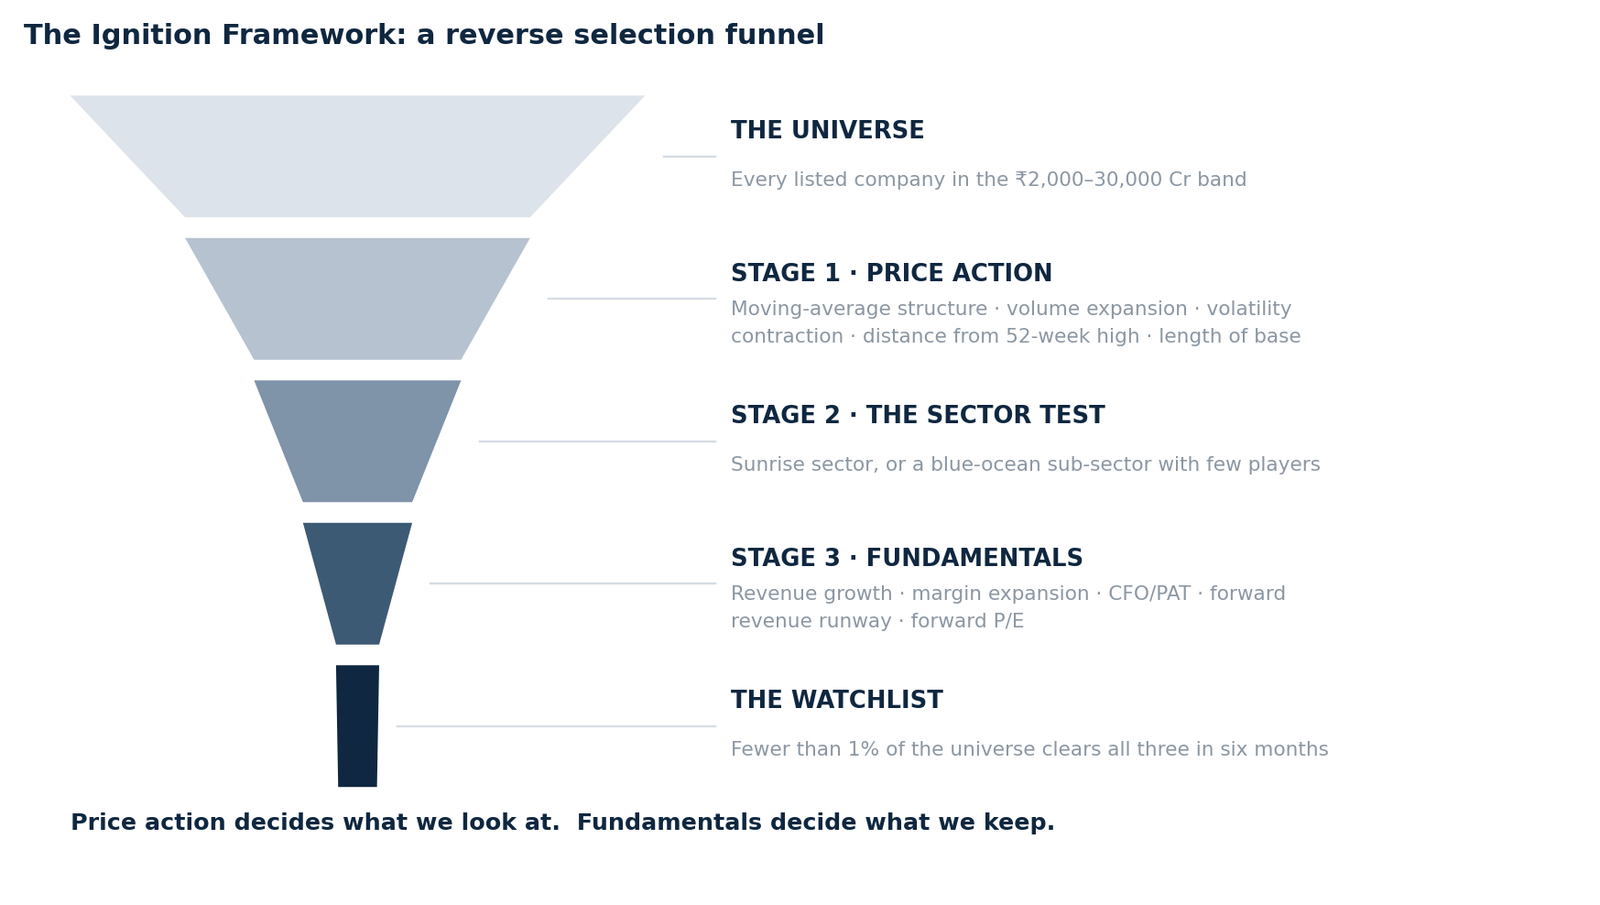
The Ignition Framework funnel
Stage 1: Price action
We publish the categories of filter in full. The specific threshold values are what our Selection subscribers pay for, and those stay behind the paywall.
|
Filter |
What it measures |
Why it matters |
|---|---|---|
|
Moving average structure |
Position of price relative to the 20, 50, and 200-day simple moving averages, and the alignment between them |
Alignment across three timeframes separates a genuine trend change from a bounce. The 200-day defines the regime; the 20 and 50 define whether the recent move has follow-through |
|
Volume expansion multiple |
Recent volume against its own longer-run average |
Price without volume is noise. A sustained volume expansion is the footprint of an institution building a position, the single best available proxy for the marginal buyer arriving |
|
Volatility contraction |
Narrowing of the price range through the consolidation |
Contracting volatility means supply is being absorbed and sellers are exhausting. It is what distinguishes a coiled base from a slow bleed |
|
Distance from the 52-week high |
How far price sits below its highest recent level |
Too far below, and the trend is not yet established. |
|
Length of contraction from peak |
Duration of the base before the move |
Short bases fail more often. Time spent consolidating is time spent transferring stock from weak holders to strong ones |
None of these is original. Their combination, the thresholds, and the fact that we apply them before looking at a single financial statement is what makes the process ours.
The thresholds are where the work actually is. Knowing that volume expansion matters is not the same as knowing the multiple we require, over what lookback, or what disqualifies a signal. Those numbers sit inside Empirica Selection - our fortnightly paid watchlist letter, where every addition ships with the screen that found it, the trend-template scorecard, the trade parameters, and the bear case written by someone other than the analyst who built the thesis. Subscribe Now
Stage 2: The sector test
A name that clears Stage 1 must then sit in a sector or sub-sector that can support a durable moat.
We define a sunrise sector by two conditions, both of which must hold:
-
Liquidity is chasing the theme at a macro level. Capital, policy capital, private capital, or global capital, is flowing toward the end market, not away from it.
-
Only a countable number of players serve the market. If you cannot name the competitors on one hand, it is not a sunrise sector, it is a crowded one.
The second condition does most of the work. Everyone can identify a growing end market. The interesting question is whether the number of companies positioned to serve it is small enough that the growth accrues to a few rather than dissipating into price competition.
Four illustrations of the test
Shaily Engineering : GLP-1 drug delivery devices. The cleanest example of the shape we look for. FY26 revenue reached ₹990.7 crore, up 26%, but the composition is the story: EBITDA rose 61% to ₹287.7 crore with margin widening from 22.7% to 29.0%, and PAT rose 83% to ₹169.9 crore. The healthcare vertical grew 139% and more than doubled its share of revenue to 40%, driven by pen injectors for semaglutide. Both sunrise conditions hold, global capital is chasing the obesity-drug end market, and the number of manufacturers qualified to make these devices at scale is very small, with industry commentary putting Shaily’s share of the GLP-1 pen market at 50–60%. Capacity is being built to match: management is adding a facility targeting a step-up from 80 million to 150 million pen injectors a year.
And it is also the best illustration of why the sector test is not a free pass. The entire thesis rests on GLP-1 drugs being injected. If oral GLP-1 formulations win meaningful share, the addressable market for the device shrinks regardless of how good the manufacturer is. That is a genuine, identifiable, single-point risk to a sunrise thesis, and finding that risk is the whole purpose of Stage 3. A sector that passes the test still has to survive the question “what makes this obsolete?”
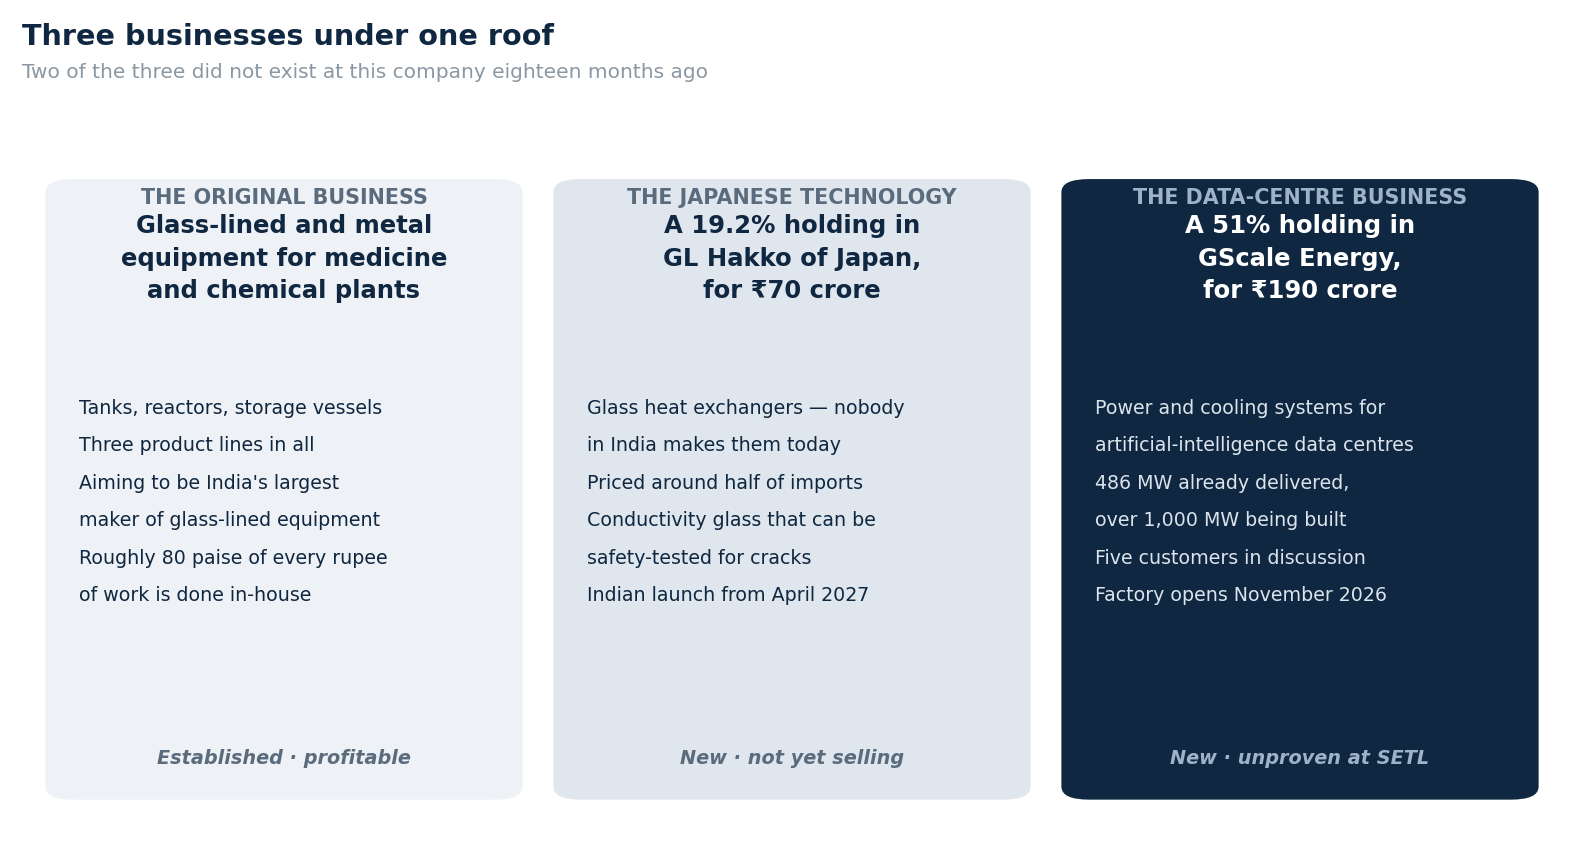
TD Power Systems : generators for gas-turbine and gas-engine power. It makes turbine, gas, hydro and industrial generators and motors, and data centre construction has become an important demand source for gas-based generation. It has taken US orders, through its subsidiary, for generators serving gas turbine applications at a data centre. Capital chasing the theme: unambiguously. Countable players: a short list globally.
Ather Energy : electric two-wheelers. A category being created rather than divided, with few credible players at the premium end. The instructive difference from the other three is timing, Ather is earlier on the curve, and earlier means the fundamental gate does more work.
BlueStone Jewellery : new-age branded jewellery. FY26 revenue grew 37.9% to ₹2,441 crore, EBITDA rose 420% to ₹394 crore, and the company turned profitable for the first full year, moving from a loss of ₹221.8 crore in FY25 to a consolidated profit. Store count reached 340, and management is targeting ₹12,000 crore of revenue over four years. The sunrise logic is that as gold gets more expensive, the design-and-brand layer captures a rising share of a purchase that used to be priced almost entirely on metal.
BlueStone also demonstrates the Recognition Gap directly. In late 2025 the operational turnaround was already visible in the numbers while the stock fell roughly a third over three months. The fundamentals moved first. The price moved later. An investor using fundamentals alone was correct and early; an investor waiting for confirmation was correct and paid.
These four are illustrations of the test, not recommendations, and each sits at a different point on the curve. What they share is the shape: an end market where capital is arriving and the supplier list is short.

Stage 3 — Fundamentals
Only now do we open the financials. Five things matter most at this stage of a company’s life:
|
Metric |
What we want to see |
Why this one |
|---|---|---|
|
Revenue growth |
Sustained, and accelerating rather than decelerating |
At this stage growth is the thesis. A business that has stopped growing has usually stopped being a sunrise story |
|
Margin expansion |
Operating margin trending up alongside revenue |
Growth with flat margins is volume. Growth with expanding margins is pricing power or improving product mix, and pricing power is what a moat looks like in the financials |
|
CFO / PAT |
Reported profit converting into actual cash |
The most important single ratio we use. A company can manufacture revenue with credit terms and manufacture profit with accounting. It cannot manufacture cash |
|
Forward revenue runway |
A credible path to multiples of current revenue |
Capacity commissioned, order book, registrations filed, addressable market — the evidence that the next three years can look nothing like the last three |
|
Forward P/E |
Valuation against forward earnings, not trailing |
A company at an earnings inflection will always look expensive on trailing numbers. Trailing P/E is the wrong lens for a business whose earnings base is about to change |
Fewer than 1% of the universe clears all three stages over a six-month period. That is the point. The framework is designed to reject, and a process that produces a long list is a process that is not working.
What this costs us at Empirica India
Every framework has a bill. Ours has three line items, and we would rather state them than have a subscriber discover them.
We miss the bottom. By construction. Anyone who bought the same name before ignition has a better entry than we do, and in a stock that eventually compounds five-fold, that first 30-40% is real money. We accept it as the cost of confirmation.
We will be shaken out sometimes. Price confirmation is evidence, not proof. Some names ignite, pull us in, and then fail, the base breaks and the thesis with it. That is the failure mode of this approach, and it is unavoidable.
We will be wrong about sunrise sectors. A market that looks like a blue ocean with three players can attract fifteen within eighteen months, and the moat we underwrote turns out to be a head start. This is the risk that hurts most, because it usually reveals itself slowly.
Where this framework breaks
Three conditions under which we would expect it to underperform, stated plainly:
In a broad, indiscriminate small-cap bull market. When everything is going up, price action loses its power to discriminate. A filter that says “the market is starting to notice” is worthless when the market is noticing everything. In those conditions the framework generates too many candidates, and the fundamental gate has to carry the entire load.
In a sharp liquidity contraction. Confirmation-based entry means we are, by definition, never at the bottom. In a fast drawdown we hold names that have already run, and those fall further and faster than the index.
When the sector thesis is right but the company is not. Correctly identifying a sunrise sector and then owning the wrong participant in it is the most expensive error available in this process. Sector conviction has a way of substituting itself for company conviction, and 3rd Checklist exists specifically to stop that from happening.
The checklist
THE IGNITION FRAMEWORK — SUMMARY
1. Market cap between ₹2,000 and ₹30,000 crore 2. Price aligned across the 20, 50 and 200-day moving averages 3. Volume expanding against its own longer-run average 4. Volatility contracting through the base 5. A base of sufficient length, at a workable distance from the 52-week high 6. Sunrise sector: capital arriving, and few enough players to name 7. Revenue growing, margins expanding, cash converting 8. A credible forward revenue runway, valued on forward earnings 9. Willing to give up the first 30-40%
All nine, or it does not reach the watchlist.
What comes next
This post covers the process up to the watchlist. It deliberately stops there, because what happens after a name reaches the watchlist, the position sizing, the entry discipline, the monitoring, the exit, is a different discipline and deserves its own treatment.
Coming issues in this series:
-
Stage analysis, and how to tell a genuine Stage 2 advance from a Stage 1 head-fake
-
Relative strength ranking for Indian stocks when you do not have access to an institutional RS screen
-
Position sizing, when and how much to increase or decrease the size
-
CFO/PAT: the one ratio that catches most accounting games
-
Moats in Indian mid-caps: which of the classic sources actually exist here
-
What we do after a name reaches the watchlist, etc
What Empirica India does
Four things, in increasing order of depth. The first is free and always will be.
1. Signal — the free letter
One investing framework per issue, worked end-to-end, every week. Stage analysis, relative strength, cash flow forensics, moat assessment, sector rotation, position sizing. Written for people who want to understand a method rather than be handed a tip.
Free. No card required.
2. Selection — the watchlist letter
Fortnightly. Two to three watchlist additions per issue, each with the exact screen that surfaced it, a snapshot of the numbers that matter, the trend-template scorecard and stage classification, trade parameters, the three-point bear case, the named monitorables we are waiting on, and the conditions that would disqualify it. Plus removals, the running ledger of every name ever added, and the reproducible screen of the fortnight.
₹6,999 a year.
3. Positioning — the research reports
Monthly. One company or sub-sector, 25 to 40 pages, built to institutional standard: business architecture, industry and TAM, moat assessment scored against named competitors, management and governance including the eight-quarter guidance-versus-delivered record, financial forensics, unit economics and capital allocation, three valuation methods including a reverse DCF, technical position, ownership and flows, and a ranked risk register. Every quarter we publish a review of every prior report — thesis intact, modified, or broken.
₹9,999 a year. Includes Selection. Capped at 250 seats.
4. Empirica India advisory
For families and individuals who would rather delegate the whole thing. Multi-asset advisory across five asset classes — fixed income, mutual funds, listed equity, AIFs, and unlisted equity — built around three priorities: consistency, low downside risk, and cashflow management.
The team is eight people, including chartered accountants, CFAs and lawyers, averaging around nine years of research experience. Every asset class has its own documented selection framework, the same way listed equity has the one described in this post.
Minimum engagement ₹50 lakhs. Tiered annual management fee, charged quarterly on investment value; the full schedule is shared on the introductory call.
Disclosures
This post is for educational purposes only. It does not constitute a recommendation to buy, sell or hold any security. Investments in securities markets are subject to market risks; read all related documents carefully before investing. At Empirica India we have been buying the mentioned companies - Ather Energy, Bluestone Jewellery, Shaily Engineering, TD Power Systems since FY25-26 and May'26.
Uddeshya Goel, CFA is registered under CFA Institute, USA and works as CIO (Chief Investment Officer) at Empirica India
© Empirica India · investempiricaindia.com